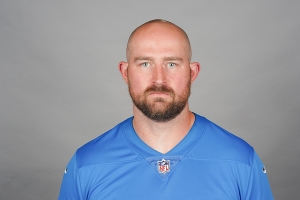
Age: 30
Free Agency: 2025 (UFA)
Accrued Seasons: 5
- Height: 6'10"
- Weight: 311
- College: Arkansas
- Entry: 2017 Undrafted Free Agent (Cowboys)
- 2024 Salary Cap Charge: $1,010,000 (0.39% of cap)
- 2024 Cash Payout: $1,150,000 (0.51% of spending)
- 2024 Cash to Cap Ratio: 1.14
- Contract Value: $1,150,000 ($1,150,000 APY)
- Fully Guaranteed Money: $0
- Contract Ranking: 44/87 at LT
Current Contract
(UFA, signed 2024)
(📝: indicates contract trigger occuring during that year)| Year | Age | Base Salary | Workout Bonus | Cap Number | Cap % | Dead Money & Cap Savings | |||
|---|---|---|---|---|---|---|---|---|---|
| 2024 | 30 | $1,125,000 | $25,000 | $1,010,000 | 0.4% | ||||
| Total | $1,125,000 | $25,000 | $1,010,000 | ||||||
Contract Notes
Dan Skipper signed a one year contract worth $1,010,000 with the Colts on August 1, 2023.
Cash Flows
- fully earned money
- unearned or partially earned money
$1.2M
| 2024 | |
|---|---|
| Cash Due | $1,150,000 |
| Running Cash | $1,150,000 |
Career Earnings: $2,770,263
Career APY: $395,752
Potential Earnings: $3,046,170
Total Guarantees: $5,000
Largest Cash Payment: $1,150,000 (2024)
Largest Cap Number: $1,010,000 (2024)
Contract History
| Team | Contract Type | Status | Year Signed | Yrs | Total | APY | Guarantees | Amount Earned | % Earned | Effective APY |
|---|---|---|---|---|---|---|---|---|---|---|
| Cowboys | UDFA | Terminated | 2017 | 3 | $1,665,000 | $555,000 | $0 | $0 | 0.0% | $0 |
| Cowboys | Practice | Terminated | 2017 | 1 | $122,400 | $122,400 | $0 | $0 | 0.0% | $0 |
| Lions | Practice | Renegotiated | 2017 | 1 | $122,400 | $122,400 | $0 | $0 | 0.0% | $0 |
| Lions | SFA | Terminated | 2017 | 2 | $1,020,000 | $510,000 | $0 | $0 | 0.0% | $0 |
| Lions | Practice | Expired | 2017 | 1 | $122,400 | $122,400 | $0 | $64,800 | 52.9% | $64,800 |
| Lions | SFA | Terminated | 2018 | 2 | $1,050,000 | $525,000 | $0 | $0 | 0.0% | $0 |
| Lions | Practice | Terminated | 2018 | 1 | $129,200 | $129,200 | $0 | $0 | 0.0% | $0 |
| Broncos | Practice | Expired | 2018 | 1 | $129,200 | $129,200 | $0 | $38,000 | 29.4% | $38,000 |
| Patriots | SFA | Terminated | 2019 | 1 | $505,000 | $505,000 | $5,000 | $0 | 0.0% | $0 |
| Patriots | Practice | Terminated | 2019 | 1 | $136,000 | $136,000 | $0 | $0 | 0.0% | $0 |
| Texans | SFA | Terminated | 2019 | 2 | $1,080,000 | $540,000 | $0 | $0 | 0.0% | $0 |
| Lions | SFA | Terminated | 2019 | 2 | $1,080,000 | $540,000 | $0 | $0 | 0.0% | $0 |
| Lions | Practice | Renegotiated | 2019 | 1 | $255,000 | $255,000 | $0 | $0 | 0.0% | $0 |
| Lions | SFA | Terminated | 2019 | 2 | $1,080,000 | $540,000 | $0 | $87,353 | 8.1% | $87,353 |
| Lions | Practice | Elevated | 2020 | 1 | $142,800 | $142,800 | $0 | $0 | 0.0% | $0 |
| Lions | Practice | Elevated | 2020 | 1 | $142,800 | $142,800 | $0 | $0 | 0.0% | $0 |
| Lions | Practice | Renegotiated | 2020 | 1 | $155,012 | $155,012 | $0 | $0 | 0.0% | $0 |
| Lions | SFA | Terminated | 2020 | 2 | $1,525,000 | $762,500 | $0 | $119,118 | 7.8% | $119,118 |
| Raiders | Practice | Terminated | 2021 | 1 | $165,600 | $165,600 | $0 | $0 | 0.0% | $0 |
| Lions | Practice | Expired | 2021 | 1 | $165,600 | $165,600 | $0 | $111,622 | 67.4% | $111,622 |
| Lions | Practice | Elevated | 2021 | 1 | $165,600 | $165,600 | $0 | $0 | 0.0% | $0 |
| Lions | SFA | Terminated | 2022 | 1 | $895,000 | $895,000 | $0 | $0 | 0.0% | $0 |
| Lions | Practice | Renegotiated | 2022 | 1 | $283,444 | $283,444 | $0 | $0 | 0.0% | $0 |
| Lions | Practice | Elevated | 2022 | 1 | $207,000 | $207,000 | $0 | $0 | 0.0% | $0 |
| Lions | Practice | Elevated | 2022 | 1 | $245,222 | $245,222 | $0 | $0 | 0.0% | $0 |
| Lions | SFA | Expired | 2022 | 1 | $895,000 | $895,000 | $0 | $745,833 | 83.3% | $745,833 |
| Colts | SFA | Terminated | 2023 | 1 | $1,010,000 | $1,010,000 | $0 | $0 | 0.0% | $0 |
| Colts | Practice | Terminated | 2023 | 1 | $289,800 | $289,800 | $0 | $0 | 0.0% | $0 |
| Lions | Practice | Elevated | 2023 | 1 | $289,800 | $289,800 | $0 | $0 | 0.0% | $0 |
| Lions | Practice | Renegotiated | 2023 | 1 | $297,611 | $297,611 | $0 | $0 | 0.0% | $0 |
| Lions | SFA | Expired | 2023 | 1 | $1,010,000 | $1,010,000 | $0 | $729,444 | 72.2% | $729,444 |
| Lions | UFA | Active | 2024 | 1 | $1,150,000 | $1,150,000 | $0 | $0 | 0.0% | $0 |
Earnings By Team
| Team | Yrs | Salary | APY | Paid on Cap | % Paid on Cap | Paid as Dead Money | % Paid as Dead Money |
|---|---|---|---|---|---|---|---|
| Cowboys | 0 | $27,600 | $0 | $0 | 0.0% | $27,600 | 0.0% |
| Lions | 6 | $2,493,393 | $415,566 | $1,858,170 | 0.0% | $635,223 | 0.0% |
| Broncos | 1 | $38,000 | $38,000 | $38,000 | 0.0% | $0 | 0.0% |
| Patriots | 0 | $58,000 | $0 | $0 | 0.0% | $58,000 | 0.0% |
| Texans | 0 | $116,470 | $0 | $0 | 0.0% | $116,470 | 0.0% |
| Raiders | 0 | $36,800 | $0 | $0 | 0.0% | $36,800 | 0.0% |
| Colts | 0 | $0 | $0 | $0 | 0.0% | $0 | 0.0% |
Season History
| Year | Team | Base Salary | Workout Bonus | Cap Number | Cap % | Cash Paid | |
|---|---|---|---|---|---|---|---|
| 2017 | Lions | $122,400 | $0 | $64,800 | 0.0% | $64,800 | |
| 2018 | Broncos | $129,200 | $0 | $38,000 | 0.0% | $38,000 | |
| 2019 | Lions | $495,000 | $0 | $87,353 | 0.0% | $87,353 | |
| 2020 | Lions | $675,000 | $0 | $119,118 | 0.1% | $119,118 | |
| 2021 | Lions | $165,600 | $0 | $111,622 | 0.1% | $111,622 | |
| 2022 | Lions | $895,000 | $0 | $745,833 | 0.3% | $745,833 | |
| 2023 | Lions | $1,010,000 | $0 | $729,444 | 0.3% | $729,444 | |
| 2024 | Lions | $1,125,000 | $25,000 | $1,010,000 | 0.4% | $1,150,000 | |
| Total | $4,617,200 | $25,000 | $2,906,170 | $3,046,170 | |||
Dead Money History
| Team | Year | Cap Charge | Cash Paid |
|---|---|---|---|
| Cowboys | 2017 | $21,600 | $21,600 |
| Lions | 2017 | $28,800 | $28,800 |
| Lions | 2017 | $27,353 | $27,353 |
| Cowboys | 2017 | $2,000 | $6,000 |
| Cowboys | 2018 | $4,000 | $0 |
| Lions | 2018 | $7,600 | $7,600 |
| Lions | 2019 | $30,000 | $30,000 |
| Lions | 2019 | $58,236 | $58,236 |
| Texans | 2019 | $116,470 | $116,470 |
| Patriots | 2019 | $48,000 | $48,000 |
| Patriots | 2019 | $10,000 | $10,000 |
| Lions | 2020 | $25,000 | $25,000 |
| Lions | 2020 | $129,812 | $129,812 |
| Lions | 2021 | $129,167 | $129,167 |
| Raiders | 2021 | $36,800 | $36,800 |
| Lions | 2022 | $110,944 | $110,944 |
| Lions | 2023 | $88,311 | $88,311 | Total | $874,093 | $874,093 |
Statistics
| Year | Games Played | Games Inactive | Snaps | ||
|---|---|---|---|---|---|
| Injured | Healthy | Offense | Special | ||
| 2017 | 1 | 0 | 0 | 1.0% | 1.1% |
| 2019 | 6 | 0 | 1 | 4.2% | 9.7% |
| 2020 | 5 | 0 | 0 | 0.3% | 8.3% |
| 2021 | 1 | 0 | 1 | 0.0% | 1.4% |
| 2022 | 15 | 0 | 0 | 33.5% | 15.2% |
| 2023 | 11 | 0 | 0 | 8.6% | 8.1% |
Valuation Diamond
The diamond is a scatterplot graph that visualizes the relation of the player's APY (in green) and performance (in blue, as measured by OTC's Valuations) to the rest of the league at his position. To understand how to read the diamond, read this explainer.
| OTC Valuation | APY | |
|---|---|---|
| Regular | $1,100,000 | $1,150,000 |
| Injury Adjusted | $1,100,000 | $1,150,000 |
test
Weekly Valuation Trends
The chart below illustrates the trend of the player's weekly OTC Valuations (in blue) from the most recent season, using APY (in green) and, if applicable, cash that is due to the player in the next season (in red) as benchmarks. Weeks not plotted indicate that the player was inactive or on a bye.
To see interactive and more in-depth use of OTC Valuation data, subscribe to OTC Premium.

