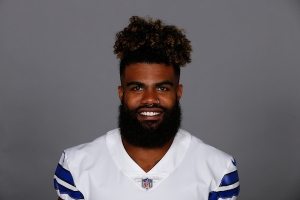
Ezekiel Elliott
Running Back
Career Earnings: $73,896,145
Career APY: $9,237,018
Total Guarantees: $54,108,475
Largest Cash Payment: $19,800,000 (2020)
Largest Cap Number: $18,220,000 (2022)
- Date of Birth: July 22, 1995
- Height: 6'0"
- Weight: 225
- College: Ohio State
- Entry: 2016 Draft, Round 1, #4 overall (Cowboys)
Contract History
| Team | Contract Type | Status | Year Signed | Yrs | Total | APY | Guarantees | Amount Earned | % Earned | Effective APY |
|---|---|---|---|---|---|---|---|---|---|---|
| Cowboys | Drafted | Renegotiated | 2016 | 4 | $24,956,338 | $6,239,085 | $24,956,338 | $20,544,008 | 82.3% | $6,848,003 |
| Cowboys | Extension | June 1 Terminated | 2019 | 6 | $90,000,000 | $15,000,000 | $28,052,137 | $50,052,137 | 55.6% | $12,513,034 |
| Patriots | SFA | Expired | 2023 | 1 | $3,000,000 | $3,000,000 | $1,100,000 | $3,300,000 | 110.0% | $3,300,000 |
Earnings By Team
| Team | Yrs | Salary | APY | Paid on Cap | % Paid on Cap | Paid as Dead Money | % Paid as Dead Money |
|---|---|---|---|---|---|---|---|
| Cowboys | 7 | $70,596,145 | $10,085,164 | $58,736,145 | 0.0% | $11,860,000 | 0.0% |
| Patriots | 1 | $3,300,000 | $3,300,000 | $3,000,000 | 0.0% | $0 | 0.0% |
Season History
| Year | Team | Base Salary | Prorated Bonus | Per Game Roster Bonus | Guaranteed Salary | Cap Number | Cap % | Cash Paid | ||
|---|---|---|---|---|---|---|---|---|---|---|
| 2016 | Cowboys | $450,000 | $4,087,516 | $0 | $450,000 | $4,537,516 | 2.9% | $16,800,064 | ||
| 2017 | Cowboys | $1,584,379 | $4,087,516 | $0 | $1,584,379 | $5,112,702 | 3.0% | $1,025,186 | ||
| 2018 | Cowboys | $2,718,758 | $4,087,516 | $0 | $2,718,758 | $6,806,274 | 3.7% | $2,718,758 | ||
| 2019 | Cowboys | $752,137 | $5,587,516 | $0 | $752,137 | $6,339,653 | 3.2% | $8,252,137 | ||
| 2020 | Cowboys | $6,800,000 | $4,100,000 | $0 | $6,800,000 | $10,900,000 | 5.0% | $19,800,000 | ||
| 2021 | Cowboys | $1,000,000 | $5,820,000 | $0 | $1,000,000 | $6,820,000 | 3.3% | $9,600,000 | ||
| 2022 | Cowboys | $12,400,000 | $5,820,000 | $0 | $12,400,000 | $18,220,000 | 8.3% | $12,400,000 | ||
| 2023 | Patriots | $1,550,000 | $600,000 | $850,000 | $500,000 | $3,000,000 | 1.4% | $3,300,000 | ||
| Total | $27,255,274 | $34,190,064 | $850,000 | $26,205,274 | $61,736,145 | $73,896,145 | ||||
Statistics
| Year | Games Played | Games Inactive | Snaps | Rushing | Receiving | Fumbles | |||||||||
|---|---|---|---|---|---|---|---|---|---|---|---|---|---|---|---|
| Injured | Healthy | Offense | Special | Att | Yards | Avg | TD | Rec | Yards | Avg | TD | Total | Lost | ||
| 2016 | 15 | 0 | 0 | 67.3% | 1.4% | 322 | 1631 | 5.1 | 15 | 32 | 363 | 11.3 | 1 | 5 | 1 |
| 2017 | 10 | 0 | 0 | 55.3% | 0.5% | 215 | 880 | 4.1 | 7 | 23 | 231 | 10.0 | 2 | 1 | 1 |
| 2018 | 15 | 0 | 1 | 82.8% | 1.2% | 304 | 1434 | 4.7 | 6 | 77 | 567 | 7.4 | 3 | 6 | 1 |
| 2019 | 16 | 0 | 0 | 83.3% | 0.9% | 301 | 1357 | 4.5 | 12 | 54 | 420 | 7.8 | 2 | 3 | 2 |
| 2020 | 15 | 1 | 0 | 68.7% | 0.0% | 244 | 979 | 4.0 | 6 | 52 | 338 | 6.5 | 2 | 0 | 0 |
| 2021 | 17 | 0 | 0 | 65.9% | 0.0% | 237 | 1002 | 4.2 | 10 | 47 | 287 | 6.1 | 2 | 0 | 0 |
| 2022 | 15 | 2 | 0 | 47.2% | 0.0% | 231 | 876 | 3.8 | 12 | 17 | 92 | 5.4 | 0 | 0 | 0 |
| 2023 | 17 | 0 | 0 | 51.3% | 0.2% | 184 | 642 | 3.5 | 3 | 51 | 313 | 6.1 | 2 | 0 | 0 |