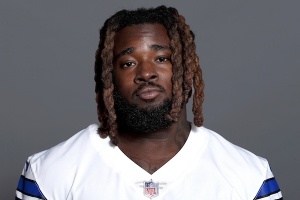
Ronald Jones II
Running Back
Career Earnings: $8,724,426
Career APY: $1,744,885
Total Guarantees: $4,275,720
Largest Cash Payment: $3,703,220 (2018)
Largest Cap Number: $2,250,158 (2021)
- Date of Birth: August 3, 1997
- Height: 6'0"
- Weight: 200
- College: USC
- Entry: 2018 Draft, Round 2, #38 overall (Buccaneers)
Contract History
| Team | Contract Type | Status | Year Signed | Yrs | Total | APY | Guarantees | Amount Earned | % Earned | Effective APY |
|---|---|---|---|---|---|---|---|---|---|---|
| Buccaneers | Drafted | Expired | 2018 | 4 | $7,071,926 | $1,767,982 | $3,223,220 | $7,071,926 | 100.0% | $1,767,982 |
| Chiefs | UFA | Expired | 2022 | 1 | $1,500,000 | $1,500,000 | $750,000 | $1,500,000 | 100.0% | $1,500,000 |
| Cowboys | UFA | Terminated | 2023 | 1 | $1,232,500 | $1,232,500 | $302,500 | $0 | 0.0% | $0 |
Earnings By Team
| Team | Yrs | Salary | APY | Paid on Cap | % Paid on Cap | Paid as Dead Money | % Paid as Dead Money |
|---|---|---|---|---|---|---|---|
| Buccaneers | 4 | $7,071,926 | $1,767,982 | $7,071,926 | 0.0% | $0 | 0.0% |
| Chiefs | 1 | $1,500,000 | $1,500,000 | $1,500,000 | 0.0% | $0 | 0.0% |
| Cowboys | 0 | $152,500 | $0 | $0 | 0.0% | $152,500 | 0.0% |
Season History
| Year | Team | Base Salary | Prorated Bonus | Guaranteed Salary | Cap Number | Cap % | Cash Paid | ||
|---|---|---|---|---|---|---|---|---|---|
| 2018 | Buccaneers | $480,000 | $805,805 | $480,000 | $1,285,805 | 0.7% | $3,703,220 | ||
| 2019 | Buccaneers | $801,451 | $805,805 | $801,451 | $1,607,256 | 0.8% | $801,451 | ||
| 2020 | Buccaneers | $1,122,902 | $805,805 | $0 | $1,928,707 | 0.9% | $1,122,902 | ||
| 2021 | Buccaneers | $1,444,353 | $805,805 | $0 | $2,250,158 | 1.2% | $1,444,353 | ||
| 2022 | Chiefs | $1,250,000 | $250,000 | $500,000 | $1,500,000 | 0.7% | $1,500,000 | ||
| Total | $5,098,706 | $3,473,220 | $1,781,451 | $8,571,926 | $8,571,926 | ||||
Dead Money History
| Team | Year | Cap Charge | Cash Paid |
|---|---|---|---|
| Cowboys | 2023 | $152,500 | $152,500 | Total | $152,500 | $152,500 |
Statistics
| Year | Games Played | Games Inactive | Snaps | Rushing | Receiving | Fumbles | |||||||||
|---|---|---|---|---|---|---|---|---|---|---|---|---|---|---|---|
| Injured | Healthy | Offense | Special | Att | Yards | Avg | TD | Rec | Yards | Avg | TD | Total | Lost | ||
| 2018 | 9 | 4 | 3 | 8.1% | 20.1% | 23 | 44 | 1.9 | 1 | 7 | 33 | 4.7 | 0 | 0 | 0 |
| 2019 | 16 | 0 | 0 | 36.3% | 1.2% | 172 | 724 | 4.2 | 6 | 31 | 309 | 10.0 | 0 | 3 | 2 |
| 2020 | 14 | 0 | 0 | 42.0% | 0.0% | 192 | 978 | 5.1 | 7 | 28 | 165 | 5.9 | 1 | 0 | 0 |
| 2021 | 16 | 1 | 0 | 18.5% | 0.0% | 101 | 428 | 4.2 | 4 | 10 | 64 | 6.4 | 0 | 0 | 0 |
| 2022 | 6 | 0 | 10 | 3.3% | 0.0% | 17 | 70 | 4.1 | 1 | 1 | 22 | 22.0 | 0 | 0 | 0 |