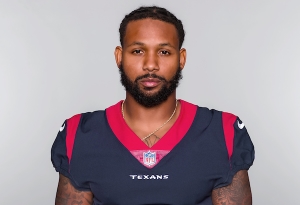
Steven Nelson
Cornerback
Career Earnings: $36,499,713
Career APY: $4,055,524
Total Guarantees: $17,081,948
Largest Cash Payment: $9,000,000 (2019)
Largest Cap Number: $7,080,000 (2020)
- Date of Birth: January 22, 1993
- Height: 5'10"
- Weight: 197
- College: Oregon State
- Entry: 2015 Draft, Round 3, #98 overall (Chiefs)
Contract History
| Team | Contract Type | Status | Year Signed | Yrs | Total | APY | Guarantees | Amount Earned | % Earned | Effective APY |
|---|---|---|---|---|---|---|---|---|---|---|
| Chiefs | Drafted | Expired | 2015 | 4 | $2,902,948 | $725,737 | $581,948 | $4,087,948 | 140.8% | $1,021,987 |
| Steelers | UFA | Terminated | 2019 | 3 | $25,500,000 | $8,500,000 | $7,500,000 | $17,250,000 | 67.6% | $8,625,000 |
| Eagles | SFA | Expired | 2021 | 1 | $2,500,000 | $2,500,000 | $2,500,000 | $4,000,000 | 160.0% | $4,000,000 |
| Texans | UFA | Renegotiated | 2022 | 2 | $9,000,000 | $4,500,000 | $4,500,000 | $4,661,765 | 51.8% | $4,661,765 |
| Texans | Other | Expired | 2023 | 1 | $5,500,000 | $5,500,000 | $2,000,000 | $6,500,000 | 118.2% | $6,500,000 |
Earnings By Team
| Team | Yrs | Salary | APY | Paid on Cap | % Paid on Cap | Paid as Dead Money | % Paid as Dead Money |
|---|---|---|---|---|---|---|---|
| Chiefs | 4 | $4,087,948 | $1,021,987 | $4,089,948 | 0.0% | $0 | 0.0% |
| Steelers | 2 | $17,250,000 | $8,625,000 | $11,080,000 | 0.0% | $6,170,000 | 0.0% |
| Eagles | 1 | $4,000,000 | $4,000,000 | $2,492,000 | 0.0% | $1,508,000 | 0.0% |
| Texans | 2 | $11,161,765 | $5,580,883 | $9,101,294 | 0.0% | $1,134,000 | 0.0% |
Season History
| Year | Team | Base Salary | Prorated Bonus | Per Game Roster Bonus | Workout Bonus | Other Bonus | Guaranteed Salary | Cap Number | Cap % | Cash Paid | ||
|---|---|---|---|---|---|---|---|---|---|---|---|---|
| 2015 | Chiefs | $435,000 | $145,487 | $0 | $0 | $0 | $0 | $580,487 | 0.4% | $1,016,948 | ||
| 2016 | Chiefs | $527,500 | $145,487 | $0 | $10,000 | $0 | $0 | $682,987 | 0.4% | $535,500 | ||
| 2017 | Chiefs | $618,500 | $145,487 | $0 | $10,000 | $0 | $0 | $773,987 | 0.5% | $628,500 | ||
| 2018 | Chiefs | $1,897,000 | $145,487 | $0 | $10,000 | $0 | $0 | $2,052,487 | 1.2% | $1,907,000 | ||
| 2019 | Steelers | $1,500,000 | $2,500,000 | $0 | $0 | $0 | $0 | $4,000,000 | 1.9% | $9,000,000 | ||
| 2020 | Steelers | $910,000 | $6,170,000 | $0 | $0 | $0 | $0 | $7,080,000 | 3.5% | $8,250,000 | ||
| 2021 | Eagles | $990,000 | $377,000 | $0 | $0 | $1,125,000 | $0 | $2,492,000 | 1.2% | $4,000,000 | ||
| 2022 | Texans | $1,750,000 | $1,000,000 | $750,000 | $0 | $250,000 | $1,750,000 | $3,705,882 | 1.7% | $4,661,765 | ||
| 2023 | Texans | $1,165,000 | $2,283,500 | $500,000 | $0 | $0 | $582,500 | $5,395,412 | 2.3% | $6,500,000 | ||
| Total | $9,793,000 | $12,912,448 | $1,250,000 | $30,000 | $1,375,000 | $2,332,500 | $26,763,242 | $36,499,713 | ||||
Statistics
| Year | Games Played | Games Inactive | Snaps | Tackles | Negative Plays | Interceptions | Fumbles | TD | ||||||||||
|---|---|---|---|---|---|---|---|---|---|---|---|---|---|---|---|---|---|---|
| Injured | Healthy | Defense | Special | Solo | Assist | Sacks | Yards | TFL | QB Hits | Pass Def. | INT | Yards | Forced | Rec. | Yards | |||
| 2015 | 12 | 0 | 4 | 4.9% | 28.4% | 8 | 0 | 0 | 0 | 0 | 0 | 0 | 0 | 0 | 0 | 0 | 0 | 0 |
| 2016 | 15 | 1 | 0 | 90.8% | 26.1% | 59 | 6 | 0 | 0 | 4 | 1 | 16 | 0 | 0 | 0 | 2 | 0 | 0 |
| 2017 | 9 | 8 | 0 | 46.6% | 7.6% | 33 | 8 | 0 | 0 | 2 | 0 | 4 | 0 | 0 | 1 | 0 | 0 | 0 |
| 2018 | 16 | 0 | 0 | 98.8% | 0.2% | 58 | 10 | 0 | 0 | 2 | 0 | 15 | 4 | 53 | 0 | 0 | 0 | 0 |
| 2019 | 15 | 1 | 0 | 93.6% | 14.0% | 52 | 9 | 0 | 0 | 0 | 0 | 7 | 1 | 33 | 0 | 1 | 0 | 0 |
| 2020 | 15 | 1 | 0 | 88.1% | 11.4% | 43 | 5 | 0 | 0 | 2 | 0 | 9 | 2 | 0 | 0 | 1 | 0 | 0 |
| 2021 | 16 | 0 | 1 | 87.2% | 0.0% | 34 | 16 | 0 | 0 | 0 | 0 | 7 | 1 | 0 | 0 | 0 | 0 | 0 |
| 2022 | 15 | 2 | 0 | 81.7% | 0.2% | 39 | 13 | 1 | 7 | 1 | 1 | 7 | 1 | 0 | 1 | 0 | 0 | 0 |
| 2023 | 17 | 0 | 0 | 89.8% | 14.5% | 48 | 15 | 0 | 0 | 0 | 0 | 12 | 4 | 0 | 0 | 0 | 0 | 0 |