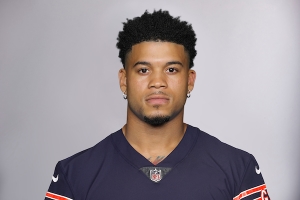
Teez Tabor
Cornerback
Career Earnings: $4,536,324
Career APY: $756,054
Total Guarantees: $2,796,846
Largest Cash Payment: $2,112,620 (2017)
Largest Cap Number: $1,096,131 (2018)
- Date of Birth: December 31, 1995
- Height: 6'0"
- Weight: 199
- College: Florida
- Entry: 2017 Draft, Round 2, #53 overall (Lions)
Contract History
| Team | Contract Type | Status | Year Signed | Yrs | Total | APY | Guarantees | Amount Earned | % Earned | Effective APY |
|---|---|---|---|---|---|---|---|---|---|---|
| Lions | Drafted | Terminated | 2017 | 4 | $4,822,976 | $1,205,744 | $2,796,846 | $2,796,846 | 58.0% | $1,398,423 |
| 49ers | Practice | Expired | 2019 | 1 | $136,000 | $136,000 | $0 | $104,000 | 76.5% | $104,000 |
| 49ers | SFA | Terminated | 2020 | 1 | $660,000 | $660,000 | $0 | $0 | 0.0% | $0 |
| Bears | Practice | Expired | 2020 | 1 | $142,800 | $142,800 | $0 | $16,800 | 11.8% | $16,800 |
| Bears | SFA | Terminated | 2021 | 1 | $850,000 | $850,000 | $0 | $0 | 0.0% | $0 |
| Bears | Practice | Renegotiated | 2021 | 1 | $165,600 | $165,600 | $0 | $0 | 0.0% | $0 |
| Bears | SFA | Expired | 2021 | 1 | $850,000 | $850,000 | $0 | $523,889 | 61.6% | $523,889 |
| Falcons | SFA | Terminated | 2022 | 1 | $965,000 | $965,000 | $0 | $0 | 0.0% | $0 |
| Falcons | Practice | Terminated | 2022 | 1 | $358,200 | $358,200 | $0 | $0 | 0.0% | $0 |
| Seahawks | SFA | Expired | 2022 | 1 | $965,000 | $965,000 | $0 | $911,389 | 94.4% | $911,389 |
| Colts | SFA | Terminated | 2023 | 1 | $1,080,000 | $1,080,000 | $0 | $0 | 0.0% | $0 |
| Seahawks | Practice | Elevated | 2023 | 1 | $289,800 | $289,800 | $0 | $0 | 0.0% | $0 |
| Seahawks | Practice | Terminated | 2023 | 1 | $301,500 | $301,500 | $0 | $0 | 0.0% | $0 |
Earnings By Team
| Team | Yrs | Salary | APY | Paid on Cap | % Paid on Cap | Paid as Dead Money | % Paid as Dead Money |
|---|---|---|---|---|---|---|---|
| Lions | 2 | $2,796,846 | $1,398,423 | $1,973,036 | 0.0% | $823,810 | 0.0% |
| 49ers | 1 | $104,000 | $104,000 | $104,000 | 0.0% | $0 | 0.0% |
| Bears | 2 | $595,889 | $297,945 | $540,689 | 0.0% | $55,200 | 0.0% |
| Falcons | 0 | $19,900 | $0 | $0 | 0.0% | $19,900 | 0.0% |
| Seahawks | 1 | $1,019,689 | $1,019,689 | $911,389 | 0.0% | $100,522 | 0.0% |
| Colts | 0 | $0 | $0 | $0 | 0.0% | $0 | 0.0% |
Season History
| Year | Team | Base Salary | Prorated Bonus | Guaranteed Salary | Cap Number | Cap % | Cash Paid | ||
|---|---|---|---|---|---|---|---|---|---|
| 2017 | Lions | $465,000 | $411,905 | $465,000 | $876,905 | 0.5% | $2,112,620 | ||
| 2018 | Lions | $684,226 | $411,905 | $684,226 | $1,096,131 | 0.6% | $684,226 | ||
| 2019 | 49ers | $136,000 | $0 | $0 | $104,000 | 0.0% | $104,000 | ||
| 2020 | Bears | $142,800 | $0 | $0 | $16,800 | 0.0% | $16,800 | ||
| 2021 | Bears | $850,000 | $0 | $0 | $523,889 | 0.3% | $523,889 | ||
| 2022 | Seahawks | $965,000 | $0 | $0 | $911,389 | 0.4% | $911,389 | ||
| Total | $3,243,026 | $823,810 | $1,149,226 | $3,529,114 | $4,352,924 | ||||
Statistics
| Year | Games Played | Games Inactive | Snaps | Tackles | Negative Plays | Interceptions | Fumbles | TD | ||||||||||
|---|---|---|---|---|---|---|---|---|---|---|---|---|---|---|---|---|---|---|
| Injured | Healthy | Defense | Special | Solo | Assist | Sacks | Yards | TFL | QB Hits | Pass Def. | INT | Yards | Forced | Rec. | Yards | |||
| 2017 | 10 | 0 | 6 | 17.4% | 16.0% | 11 | 2 | 0 | 0 | 0 | 1 | 0 | 0 | 0 | 0 | 0 | 0 | 0 |
| 2018 | 12 | 0 | 4 | 27.9% | 37.6% | 24 | 4 | 0 | 0 | 0 | 0 | 0 | 0 | 0 | 0 | 0 | 0 | 0 |
| 2021 | 6 | 0 | 3 | 10.6% | 12.5% | 6 | 2 | 0 | 0 | 0 | 0 | 0 | 0 | 0 | 0 | 0 | 0 | 0 |
| 2022 | 10 | 0 | 6 | 8.8% | 21.5% | 5 | 3 | 0 | 0 | 0 | 0 | 0 | 0 | 0 | 0 | 0 | 0 | 0 |
| 2023 | 1 | 0 | 0 | 1.0% | 0.6% | 0 | 0 | 0 | 0 | 0 | 0 | 0 | 0 | 0 | 0 | 0 | 0 | 0 |