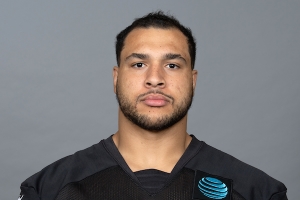
Tyeler Davison
Interior Defensive Line
Career Earnings: $11,349,502
Career APY: $1,418,688
Total Guarantees: $5,467,224
Largest Cash Payment: $4,750,000 (2020)
Largest Cap Number: $2,663,333 (2021)
- Date of Birth: September 3, 1992
- Height: 6'2"
- Weight: 316
- College: Fresno State
- Entry: 2015 Draft, Round 5, #154 overall (Saints)
Contract History
| Team | Contract Type | Status | Year Signed | Yrs | Total | APY | Guarantees | Amount Earned | % Earned | Effective APY |
|---|---|---|---|---|---|---|---|---|---|---|
| Saints | Drafted | Expired | 2015 | 4 | $2,497,224 | $624,306 | $217,224 | $3,699,224 | 148.1% | $924,806 |
| Falcons | UFA | Expired | 2019 | 1 | $895,000 | $895,000 | $200,000 | $895,000 | 100.0% | $895,000 |
| Falcons | UFA | Renegotiated | 2020 | 3 | $12,000,000 | $4,000,000 | $4,550,000 | $4,750,000 | 39.6% | $4,750,000 |
| Falcons | Other | Terminated | 2021 | 2 | $5,250,000 | $2,625,000 | $500,000 | $1,450,000 | 27.6% | $1,450,000 |
| Browns | Practice | Terminated | 2022 | 1 | $207,000 | $207,000 | $0 | $0 | 0.0% | $0 |
| Chargers | SFA | Expired | 2022 | 1 | $1,120,000 | $1,120,000 | $0 | $497,778 | 44.4% | $497,778 |
Earnings By Team
| Team | Yrs | Salary | APY | Paid on Cap | % Paid on Cap | Paid as Dead Money | % Paid as Dead Money |
|---|---|---|---|---|---|---|---|
| Saints | 4 | $3,699,224 | $924,806 | $3,699,224 | 0.0% | $0 | 0.0% |
| Falcons | 3 | $7,095,000 | $2,365,000 | $5,721,666 | 0.0% | $1,213,334 | 0.0% |
| Browns | 0 | $57,500 | $0 | $0 | 0.0% | $57,500 | 0.0% |
| Chargers | 1 | $497,778 | $497,778 | $397,778 | 0.0% | $0 | 0.0% |
Season History
| Year | Team | Base Salary | Prorated Bonus | Per Game Roster Bonus | Guaranteed Salary | Cap Number | Cap % | Cash Paid | ||
|---|---|---|---|---|---|---|---|---|---|---|
| 2015 | Saints | $435,000 | $54,306 | $0 | $0 | $489,306 | 0.3% | $652,224 | ||
| 2016 | Saints | $525,000 | $54,306 | $0 | $0 | $579,306 | 0.4% | $525,000 | ||
| 2017 | Saints | $615,000 | $54,306 | $0 | $0 | $669,306 | 0.4% | $615,000 | ||
| 2018 | Saints | $1,907,000 | $54,306 | $0 | $0 | $1,961,306 | 1.1% | $1,907,000 | ||
| 2019 | Falcons | $805,000 | $90,000 | $0 | $110,000 | $735,000 | 0.4% | $895,000 | ||
| 2020 | Falcons | $910,000 | $1,213,333 | $200,000 | $910,000 | $2,323,333 | 1.2% | $4,750,000 | ||
| 2021 | Falcons | $1,200,000 | $1,213,333 | $250,000 | $500,000 | $2,663,333 | 1.4% | $1,450,000 | ||
| 2022 | Chargers | $1,120,000 | $0 | $0 | $0 | $397,778 | 0.2% | $497,778 | ||
| Total | $7,517,000 | $2,733,890 | $450,000 | $1,520,000 | $9,818,668 | $11,292,002 | ||||
Statistics
| Year | Games Played | Games Inactive | Snaps | Tackles | Negative Plays | Interceptions | Fumbles | TD | ||||||||||
|---|---|---|---|---|---|---|---|---|---|---|---|---|---|---|---|---|---|---|
| Injured | Healthy | Defense | Special | Solo | Assist | Sacks | Yards | TFL | QB Hits | Pass Def. | INT | Yards | Forced | Rec. | Yards | |||
| 2015 | 16 | 0 | 0 | 49.8% | 34.9% | 10 | 8 | 1.5 | 8 | 4 | 5 | 0 | 0 | 0 | 0 | 0 | 0 | 0 |
| 2016 | 15 | 1 | 0 | 41.7% | 16.6% | 9 | 14 | 0 | 0 | 0 | 1 | 2 | 0 | 0 | 0 | 0 | 0 | 0 |
| 2017 | 16 | 0 | 0 | 55.5% | 16.1% | 21 | 8 | 0 | 0 | 3 | 2 | 1 | 0 | 0 | 2 | 0 | 0 | 0 |
| 2018 | 14 | 2 | 0 | 40.9% | 25.9% | 8 | 18 | 2 | 10 | 2 | 3 | 1 | 0 | 0 | 1 | 0 | 0 | 0 |
| 2019 | 16 | 0 | 0 | 53.8% | 33.3% | 26 | 29 | 1 | 2 | 4 | 2 | 0 | 0 | 0 | 0 | 1 | 0 | 0 |
| 2020 | 16 | 0 | 0 | 48.0% | 20.5% | 15 | 21 | 0.5 | 6 | 2 | 2 | 0 | 0 | 0 | 0 | 0 | 0 | 0 |
| 2021 | 12 | 0 | 4 | 30.6% | 0.2% | 10 | 20 | 0 | 0 | 3 | 0 | 0 | 0 | 0 | 0 | 0 | 0 | 0 |
| 2022 | 6 | 0 | 2 | 3.2% | 1.5% | 1 | 0 | 0 | 0 | 0 | 0 | 0 | 0 | 0 | 0 | 0 | 0 | 0 |