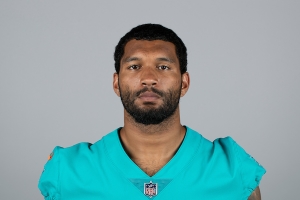
Cethan Carter
Tight End
Career Earnings: $8,552,000
Career APY: $1,425,333
Total Guarantees: $2,706,000
Largest Cash Payment: $2,700,000 (2021)
Largest Cap Number: $2,700,000 (2021)
- Date of Birth: September 5, 1995
- Height: 6'3"
- Weight: 241
- College: Nebraska
- Entry: 2017 Undrafted Free Agent (Bengals)
Contract History
| Team | Contract Type | Status | Year Signed | Yrs | Total | APY | Guarantees | Amount Earned | % Earned | Effective APY |
|---|---|---|---|---|---|---|---|---|---|---|
| Bengals | UDFA | Expired | 2017 | 3 | $1,671,000 | $557,000 | $6,000 | $1,419,000 | 84.9% | $473,000 |
| Bengals | RFA | Expired | 2020 | 1 | $2,133,000 | $2,133,000 | $0 | $2,133,000 | 100.0% | $2,133,000 |
| Dolphins | UFA | Terminated | 2021 | 3 | $7,800,000 | $2,600,000 | $2,700,000 | $5,000,000 | 64.1% | $2,500,000 |
Earnings By Team
| Team | Yrs | Salary | APY | Paid on Cap | % Paid on Cap | Paid as Dead Money | % Paid as Dead Money |
|---|---|---|---|---|---|---|---|
| Bengals | 4 | $3,552,000 | $888,000 | $3,552,000 | 0.0% | $0 | 0.0% |
| Dolphins | 2 | $5,000,000 | $2,500,000 | $5,225,000 | 0.0% | $0 | 0.0% |
Season History
| Year | Team | Base Salary | Prorated Bonus | Roster Bonus | Per Game Roster Bonus | Workout Bonus | Guaranteed Salary | Cap Number | Cap % | Cash Paid | ||
|---|---|---|---|---|---|---|---|---|---|---|---|---|
| 2017 | Bengals | $465,000 | $2,000 | $0 | $0 | $0 | $0 | $467,000 | 0.3% | $471,000 | ||
| 2018 | Bengals | $555,000 | $2,000 | $0 | $0 | $0 | $0 | $380,000 | 0.2% | $378,000 | ||
| 2019 | Bengals | $570,000 | $2,000 | $0 | $0 | $0 | $0 | $572,000 | 0.3% | $570,000 | ||
| 2020 | Bengals | $2,133,000 | $0 | $0 | $0 | $0 | $0 | $2,133,000 | 1.0% | $2,133,000 | ||
| 2021 | Dolphins | $1,200,000 | $0 | $1,500,000 | $0 | $0 | $1,200,000 | $2,700,000 | 1.4% | $2,700,000 | ||
| 2022 | Dolphins | $2,260,000 | $0 | $0 | $255,000 | $25,000 | $0 | $2,525,000 | 1.2% | $2,300,000 | ||
| Total | $7,183,000 | $6,000 | $1,500,000 | $255,000 | $25,000 | $1,200,000 | $8,777,000 | $8,552,000 | ||||
Statistics
| Year | Games Played | Games Inactive | Snaps | Rushing | Receiving | Fumbles | |||||||||
|---|---|---|---|---|---|---|---|---|---|---|---|---|---|---|---|
| Injured | Healthy | Offense | Special | Att | Yards | Avg | TD | Rec | Yards | Avg | TD | Total | Lost | ||
| 2017 | 16 | 0 | 0 | 5.1% | 63.0% | 0 | 0 | 0.0 | 0 | 0 | 0 | 0.0 | 0 | 0 | 0 |
| 2019 | 15 | 1 | 0 | 8.6% | 61.3% | 0 | 0 | 0.0 | 0 | 2 | 13 | 6.5 | 1 | 0 | 0 |
| 2020 | 15 | 0 | 1 | 20.4% | 68.6% | 0 | 0 | 0.0 | 0 | 5 | 53 | 10.6 | 0 | 0 | 0 |
| 2021 | 16 | 0 | 0 | 4.5% | 57.4% | 0 | 0 | 0.0 | 0 | 2 | 16 | 8.0 | 0 | 0 | 0 |
| 2022 | 1 | 3 | 0 | 0.1% | 0.9% | 0 | 0 | 0.0 | 0 | 0 | 0 | 0.0 | 0 | 0 | 0 |