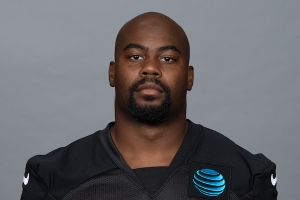
Mike Davis
Running Back
Career Earnings: $13,321,456
Career APY: $1,903,065
Total Guarantees: $10,440,060
Largest Cash Payment: $3,000,000 (2020)
Largest Cap Number: $3,000,000 (2020)
- Date of Birth: February 19, 1993
- Height: 5'9"
- Weight: 217
- College: South Carolina
- Entry: 2015 Draft, Round 4, #126 overall (49ers)
Contract History
| Team | Contract Type | Status | Year Signed | Yrs | Total | APY | Guarantees | Amount Earned | % Earned | Effective APY |
|---|---|---|---|---|---|---|---|---|---|---|
| Seahawks | Drafted | Terminated | 2015 | 4 | $2,748,780 | $687,195 | $468,780 | $0 | 0.0% | $0 |
| 49ers | Drafted | Terminated | 2015 | 4 | $2,748,780 | $687,195 | $468,780 | $1,373,721 | 50.0% | $686,861 |
| Seahawks | Practice | Renegotiated | 2017 | 1 | $122,400 | $122,400 | $0 | $0 | 0.0% | $0 |
| Seahawks | SFA | Expired | 2017 | 1 | $615,000 | $615,000 | $0 | $253,235 | 41.2% | $253,235 |
| Seahawks | SFA | Expired | 2018 | 1 | $1,350,000 | $1,350,000 | $350,000 | $1,350,000 | 100.0% | $1,350,000 |
| Bears | UFA | Terminated | 2019 | 2 | $6,000,000 | $3,000,000 | $3,000,000 | $0 | 0.0% | $0 |
| Panthers | UFA | Expired | 2019 | 2 | $6,000,000 | $3,000,000 | $3,000,000 | $3,411,765 | 56.9% | $1,705,883 |
| Falcons | UFA | Terminated | 2021 | 2 | $5,500,000 | $2,750,000 | $3,000,000 | $3,000,000 | 54.5% | $3,000,000 |
| Ravens | SFA | Terminated | 2022 | 1 | $1,272,500 | $1,272,500 | $152,500 | $0 | 0.0% | $0 |
Earnings By Team
| Team | Yrs | Salary | APY | Paid on Cap | % Paid on Cap | Paid as Dead Money | % Paid as Dead Money |
|---|---|---|---|---|---|---|---|
| Seahawks | 2 | $1,675,235 | $837,618 | $1,490,735 | 0.0% | $72,000 | 0.0% |
| 49ers | 2 | $1,373,721 | $686,861 | $1,139,331 | 0.0% | $234,390 | 0.0% |
| Bears | 0 | $2,588,235 | $0 | $0 | 0.0% | $2,588,235 | 0.0% |
| Panthers | 2 | $3,411,765 | $1,705,883 | $3,411,765 | 0.0% | $0 | 0.0% |
| Falcons | 1 | $3,000,000 | $3,000,000 | $2,250,000 | 0.0% | $750,000 | 0.0% |
| Ravens | 0 | $1,272,500 | $0 | $0 | 0.0% | $1,047,500 | 0.0% |
Season History
| Year | Team | Base Salary | Prorated Bonus | Per Game Roster Bonus | Workout Bonus | Guaranteed Salary | Cap Number | Cap % | Cash Paid | ||
|---|---|---|---|---|---|---|---|---|---|---|---|
| 2015 | 49ers | $435,000 | $117,195 | $0 | $0 | $0 | $497,136 | 0.3% | $848,721 | ||
| 2016 | 49ers | $525,000 | $117,195 | $0 | $0 | $0 | $642,195 | 0.4% | $525,000 | ||
| 2017 | Seahawks | $615,000 | $0 | $0 | $0 | $0 | $253,235 | 0.1% | $253,235 | ||
| 2018 | Seahawks | $800,000 | $350,000 | $200,000 | $0 | $0 | $1,237,500 | 0.7% | $1,350,000 | ||
| 2019 | Panthers | $1,000,000 | $0 | $0 | $0 | $411,765 | $411,765 | 0.2% | $411,765 | ||
| 2020 | Panthers | $2,950,000 | $0 | $0 | $50,000 | $0 | $3,000,000 | 1.4% | $3,000,000 | ||
| 2021 | Falcons | $1,500,000 | $750,000 | $0 | $0 | $1,500,000 | $2,250,000 | 1.2% | $3,000,000 | ||
| Total | $7,825,000 | $1,334,390 | $200,000 | $50,000 | $1,911,765 | $8,291,831 | $9,388,721 | ||||
Statistics
| Year | Games Played | Games Inactive | Snaps | Rushing | Receiving | Fumbles | |||||||||
|---|---|---|---|---|---|---|---|---|---|---|---|---|---|---|---|
| Injured | Healthy | Offense | Special | Att | Yards | Avg | TD | Rec | Yards | Avg | TD | Total | Lost | ||
| 2015 | 6 | 7 | 3 | 12.3% | 0.0% | 0 | 0 | 0.0 | 0 | 0 | 0 | 0.0 | 0 | 0 | 0 |
| 2016 | 8 | 0 | 8 | 6.4% | 12.8% | 0 | 0 | 0.0 | 0 | 0 | 0 | 0.0 | 0 | 0 | 0 |
| 2017 | 6 | 1 | 0 | 16.5% | 0.0% | 0 | 0 | 0.0 | 0 | 0 | 0 | 0.0 | 0 | 0 | 0 |
| 2018 | 15 | 0 | 1 | 36.7% | 8.3% | 0 | 0 | 0.0 | 0 | 0 | 0 | 0.0 | 0 | 0 | 0 |
| 2019 | 12 | 0 | 3 | 7.3% | 28.0% | 0 | 0 | 0.0 | 0 | 0 | 0 | 0.0 | 0 | 0 | 0 |
| 2020 | 15 | 1 | 0 | 56.2% | 7.9% | 165 | 642 | 3.9 | 6 | 59 | 373 | 6.3 | 2 | 0 | 0 |
| 2021 | 17 | 0 | 0 | 56.5% | 0.2% | 0 | 0 | 0.0 | 0 | 0 | 0 | 0.0 | 0 | 0 | 0 |
| 2022 | 7 | 0 | 4 | 3.6% | 0.0% | 8 | 18 | 2.3 | 0 | 2 | 4 | 2.0 | 0 | 0 | 0 |